
Why BikePed Count Matters
Every September, volunteers across Little Rock spend a few hours counting people walking and biking.
It sounds simple—and it is. But those counts give us something surprisingly difficult to get: a measure of how many people are walking and biking at specific places around Little Rock at a snapshot in time.
Little Rock has conducted our annual BikePed Count since 2014. By returning to many of the same locations year after year, we have built a long-term dataset that helps us understand how walking and biking are changing, where people are traveling, how activity changes before and after transportation projects, and where future investments may be most useful.
No single dataset can tell us everything about walking and biking in Little Rock. The BikePed Count is one piece of that puzzle—and an important one.
So what can the BikePed Count help us do?
1. Track change over time
Is walking increasing? Is biking? Did activity change after a new trail, bike facility, development, or street improvement?
To answer questions like these, we need measurements we can compare over time.
The U.S. Census Bureau’s American Community Survey (ACS) provides useful annual information about how Little Rock residents travel to work (Fig. 1). But commuting is only part of the picture. People also walk and bike to school, stores, restaurants, parks, bus stops, friends’ homes, and other destinations—and sometimes simply because they enjoy it.
The BikePed Count captures those trips too. By repeating counts at many of the same locations year after year, we get another way to see how walking and biking in Little Rock are changing.
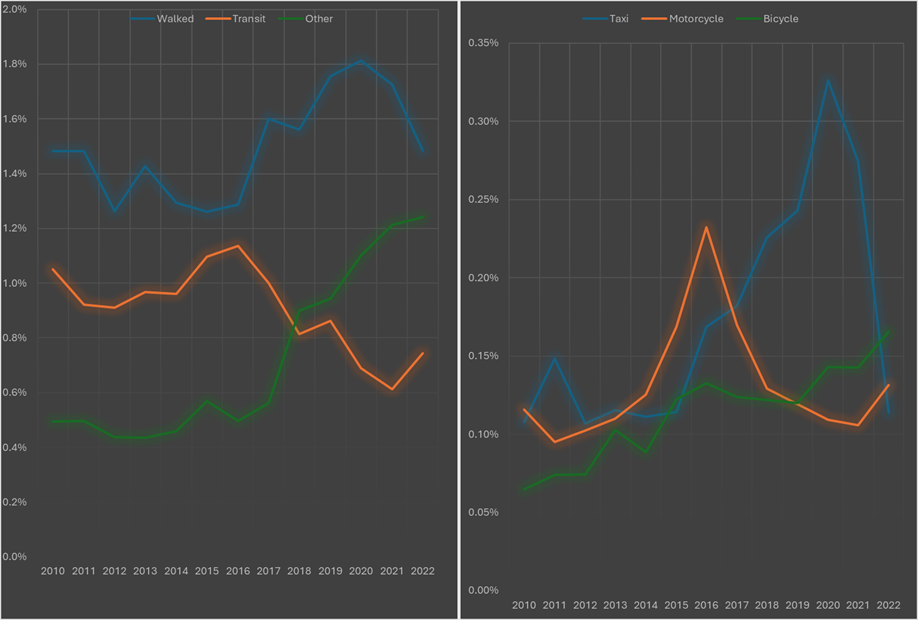
Figure 1. The U.S. American Community Survey’s annual work/school commute survey shows that walking to work/school has fluctuated in Little Rock over 12 years, but shows no overall pattern of increasing or decreasing. Biking to work in Little Rock, on the other hand, has close to tripled over those 12 years. Note that the only other mode that clearly increased is “Other”. This mode sharply increased in 2018, the same year our shared scooter programs were introduced. Scooters also benefit from bike infrastructure.
2. Understand where people are walking and biking
Knowing where people walk and bike helps us understand how our transportation network is being used.
That doesn’t mean the streets with the most people walking and biking are automatically the streets with the greatest need for improvements. Think about it this way: you can’t measure the demand for a bridge by counting how many people are swimming across the river.
A street with fast or heavy traffic and no sidewalk or bike facility may have relatively few people walking or biking precisely because it is uncomfortable or unsafe. That’s why we consider BikePed counts alongside information such as traffic volumes, number of lanes, speeds, destinations, and existing infrastructure.
Together, those pieces give us a better picture of both where people are walking and biking now and where better conditions might allow more people to do so.
3. See people other datasets may miss
Other data sources help us understand walking and biking, but every source has limitations.
Fitness apps such as Strava, for example, can provide useful information about popular walking and biking routes, but their users aren’t necessarily representative of everyone who walks and bikes in Little Rock. People using an app to track a recreational ride or run may show up clearly in those data, while someone biking to work, walking to a bus stop, or walking to the grocery store may not show up at all.
That distinction matters.
Some Little Rock households have less access to automobiles and rely more heavily on walking, biking, and transit. We don’t want transportation decisions to overlook those trips simply because the people making them aren’t recording their movements with a fitness app.
We can see this limitation in Little Rock. Census and Strava data can paint very different pictures of where people bike (Fig. 2).
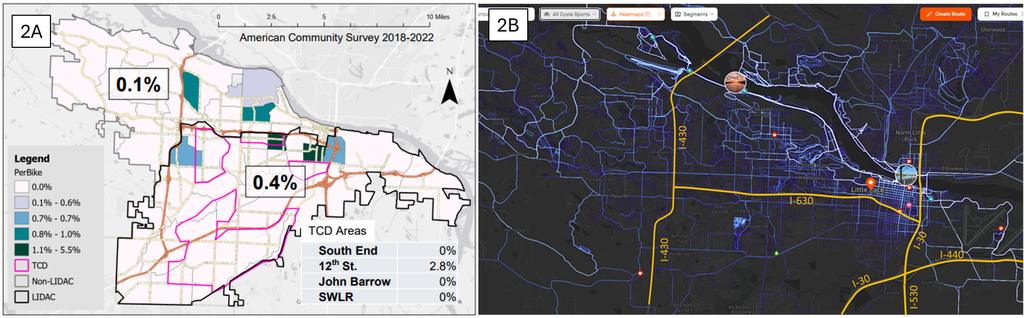
Figure 2. 2A Residents south of I-630 and east of I-30 are four times more likely to bike to work than residents north of I-630 and west of i-30 (Slide 62 of Little Rock’s Pedestrian Equity, 2024). 2B Biking activity is far more apparent on Strava north of I-630 and west of I-30 (data from Strava Global Heatmap, highways added manually for orientation). This shows how radically different conclusions about where people bike in Little Rock could be made if only relying on one dataset.
A volunteer counter doesn’t care whether someone has a smartphone, uses an app, owns an expensive bicycle, or is walking for transportation or recreation. If that person passes the count location, they count.
That makes BikePed Count a useful complement to other transportation data and helps us build a more complete picture of how people move throughout Little Rock.
4. Better understand safety
Crash data can show us where crashes are concentrated and how often they occur over time (Fig. 3). But counts can help us understand something crash records alone cannot: how many people are exposed to that risk.
Imagine two streets:
- On one street, 10 people walking or biking are involved in crashes.
- On another, 5 are involved in crashes.
Is the first street twice as dangerous?
Not necessarily.
If ten times as many people walk and bike on the first street, those numbers tell a very different story. To understand risk, we need to consider not just the number of crashes, but also the number of people walking and biking there.
That’s called exposure. Combining crash data with good information about walking and biking activity can help us move from simply counting crashes toward understanding crash rates.
Our current BikePed Count doesn’t collect enough data to calculate reliable crash rates everywhere in Little Rock. But the counts provide an important piece of information that crash records alone can’t give us.
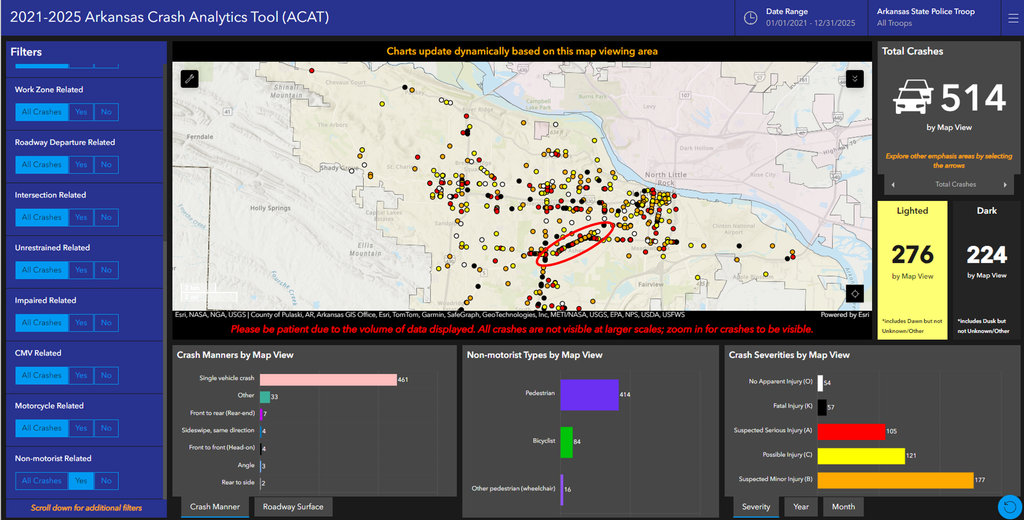
Figure 3. Arkansas Crash Analytics map showing most of Little Rock with a cluster of non-motorist related collisions along Asher Ave. circled in red.
5. Evaluate projects
Sometimes we count a location because we’ve counted it for years. Those legacy locations allow us to track long-term change. Other locations are added because something is about to change.
Counting before and after a street project, new bicycle facility, safety improvement, or nearby development can help us see whether walking and biking activity looks different after the change.
One example is the intersection of Commerce and 17th Streets in the Pettaway neighborhood. Community members identified the intersection as an important place to make safer for people walking, rolling, and biking. A community-led planning process resulted in a temporary traffic-calming project that included painted crosswalks, curb extensions, and other treatments (Fig. 4).
Because the City was involved early, we were able to establish a baseline before the project. In 2023, volunteers counted 0 bikes and 52 pedestrians on Tuesday and 4 bikes and 13 pedestrians on Saturday. In 2024, volunteers counted 26 bikes, 69 pedestrians, and 2 “other” on Tuesday.
Those observations don’t tell us whether the project caused a change in walking or biking. Short counts can vary considerably from one day to another, and we weren’t able to cover the second count period in 2024 or either period in 2025. But that’s part of what makes this example useful: data we don’t collect can’t be recreated later. More complete volunteer coverage gives us a richer record for comparing conditions before and after a project.
The essential elements of the Pettaway project have since been made permanent, giving us another reason to return to this location and continue building the record.
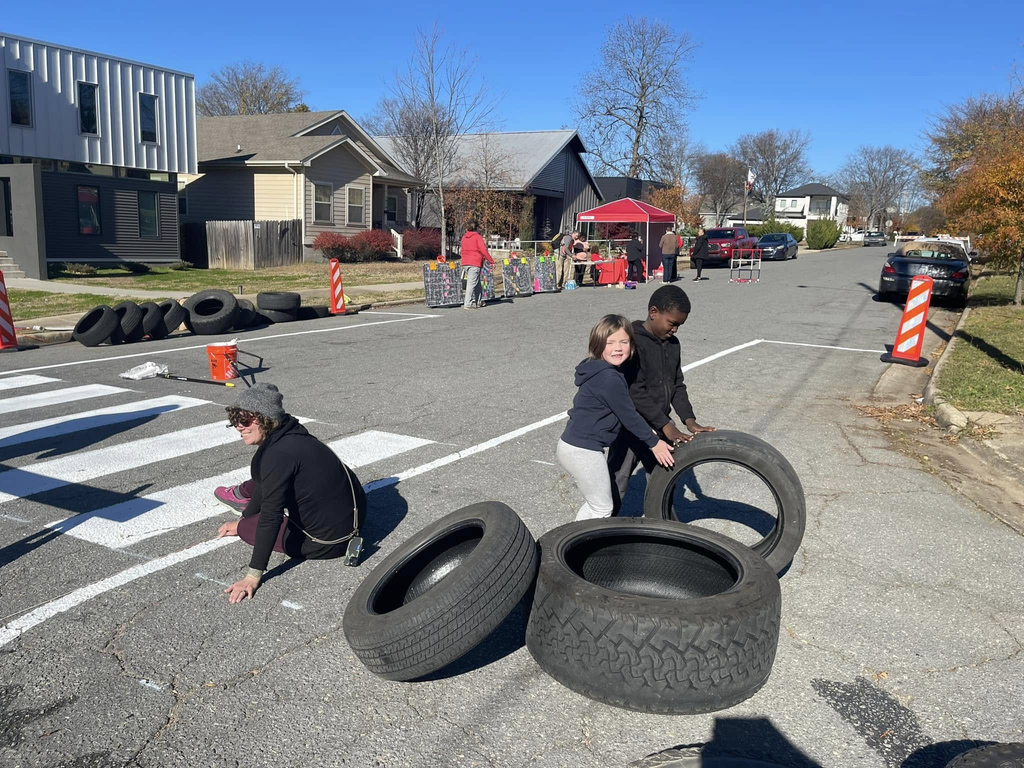
Figure 4. Painted crosswalks made the pedestrian space more visible for all road users. Curb extensions (white lines in image) forced cars to turn slower and shortened the pavement width that pedestrians and cars mixed. Tires enforced the curb extensions (photo by John Landosky).
6. Make the case for funding
Count data can also help the City compete for funding.
Grant applications are stronger when we can document a transportation need rather than simply assert that one exists. Bicycle and pedestrian counts can help show that people are already using a corridor, demonstrate how a facility connects to the larger transportation network, or provide baseline information for a proposed improvement.
Little Rock has used bicycle and pedestrian data to help support successful grant applications, including funding for improvements to gaps in the Arkansas River Trail Loop (Fig. 5). It was by referencing these data that the City of Little Rock was able to successfully demonstrate to the Federal Lands Access Program that the Arkansas River Trail “Loop” is broken and their $1.6M funding (2017) and 1.3M (2020) was required to fix it (Fig. 14).
Good data help us show not just that we think there is a need, but why an investment matters.
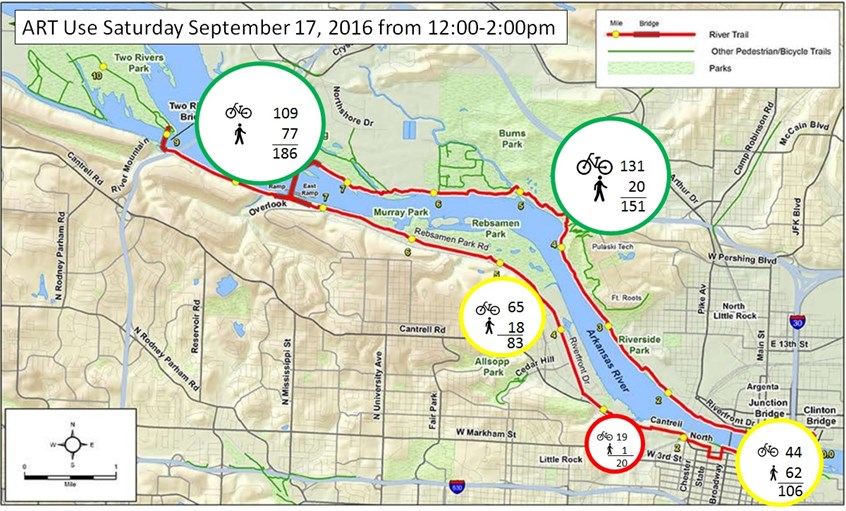
Figure 5. Our case for funding for a ramp from the Medical Mile to the bridge over the Union Pacific Tracks just west of the Department of Arkansas Heritage was strengthened because we could show with evidence what Arkansas River Trail users know by lived experience: the Arkansas River Trail Loop does not function as a loop in its current form.
What BikePed Count can—and can’t—tell us
BikePed Count is valuable, but it isn’t perfect.
Most locations are scheduled for only two two-hour count periods each year, and volunteer coverage can sometimes leave gaps. Weather, construction, special events, or just an unusually busy or quiet afternoon can also affect the numbers. And because we can count only a limited number of locations, our count sites don’t represent every street, sidewalk, trail, or neighborhood in Little Rock.
So we don’t use the BikePed Count data by itself.
We consider it alongside US Census data, crash records, traffic data, app-based information, project information, demographic data, and other sources. Each tells us something different.
The goal isn’t to find one perfect dataset. It’s to put the pieces together to better understand how people are moving around Little Rock.
And the BikePed Count gives us one piece we couldn’t have without our volunteers: people on the ground, year after year, observing what is actually happening.
Your two hours become part of a much bigger picture
Every completed count adds to a dataset Little Rock has been building since 2014.
It helps us track change.It helps us understand where people are walking and biking.It helps us see trips other datasets may miss.It helps us think more carefully about safety.It helps us evaluate projects.It helps us make the case for future investments.
That’s why your count matters.