| | Google Streetview | | | | | | | | | | | | | | | Direct Observation (all 2021) | | | | | | | | | | | | | | | | | | | | | | | | | | | Totals | | | | | | |
| Day | Unk. | Unk. | Unk. | Unk. | Unk. | Unk. | Unk. | Unk. | Unk. | Unk. | Unk. | Unk. | Unk. | Unk. | Unk. | Unk. | Unk. | Tues | Mon | Thurs | Thurs | Tues | Sun | Tues | Thurs | Fri | Sat | Sun | Mon | Sat | Thur | Fri | Mon | Tues | Wed | Thurs | Sun | Tues | Wed | Sat | Tues | Wed | Thurs | Mon | Wed | Sun | Tuesday | | | | | | | |
| Year/Date | 2007 | 2011 | 2011 | 2013 | 2014 | 2015 | 2015 | 2016 | 2016 | 2016 | 2017 | 2017 | 2017 | 2018 | 2019 | 2019 | 2019 | 3/30 | 4/5 | 4/8 | 4/15 | 4/20 | 4/25 | 5/25 | 5/27 | 5/28 | 5/29 | 5/30 | 5/31 | 6/5 | 7/8 | 7/9 | 7/12 | 7/13 | 7/14 | 7/15 | 7/18 | 7/20 | 7/21 | 7/24 | 7/27 | 7/28 | 7/29 | 8/2 | 8/4 | 8/8 | 8/10 | | | | | | * | |
| Block/Time | daylight | daylight | daylight | daylight | daylight | daylight | daylight | daylight | daylight | daylight | daylight | daylight | daylight | daylight | daylight | daylight | daylight | 9:52am | 2:12pm | 2:11pm | 2:45pm | 12:58pm | 5:34pm | 2:51pm | 11:08am | 8:23am | 9:13am | 12:07pm | 9:22am | 3:20pm | 11:00am | 1:38pm | 11:45am | 11:14am | 9:40am | 11:51am | 3:56pm | 12:35pm | 12:58pm | 1:20pm | 8:32am | 4:34pm | 5:33pm | 3:39pm | 2:14pm | 3:14pm | 12:56pm | # of Obs | Mean | Median | StDev | Capacity* | % Capacity | |
| 1 | 7 | | | 6 | 10 | 8 | | | | 7 | | 5 | | 6 | | 8 | 5 | 4 | 6 | 3 | 6 | 5 | 5 | 5 | 6 | 6 | 8 | 6 | 10 | 8 | 9 | 9 | 9 | 4 | 9 | 10 | 6 | 7 | 6 | 8 | 6 | 10 | 10 | 6 | 6 | 10 | 5 | 39 | 6.9 | 6 | 2.0 | 9 | 66.7% | |
| 2 | 5 | | | 2 | 5 | 3 | | | | 4 | | 5 | | 1 | | 6 | 5 | 6 | 5 | 3 | 7 | 7 | 12 | 7 | 7 | 9 | 11 | 11 | 9 | 8 | 7 | 8 | 5 | 7 | 6 | 4 | 5 | 4 | 4 | 5 | 6 | 5 | 5 | 6 | 5 | 4 | 3 | 39 | 5.8 | 5 | 2.4 | 13 | 38.5% | |
| 3 | 3 | | | 1 | 3 | 2 | | | | 4 | | 1 | | 1 | 1 | 2 | 0 | 2 | 0 | 3 | 3 | 1 | 0 | 0 | 0 | 0 | 0 | 0 | 1 | 3 | 1 | 2 | 2 | 1 | 2 | 1 | 3 | 2 | 3 | 1 | 1 | 2 | 2 | 4 | 2 | 3 | 2 | 40 | 1.6 | 2 | 1.2 | 12 | 16.7% | |
| 4 | 2 | | | 2 | 4 | 4 | | | | 7 | | 4 | | 6 | 6 | 4 | 4 | 6 | 5 | 9 | 2 | 4 | 8 | 5 | 4 | 6 | 6 | 8 | 8 | 8 | 6 | 5 | 5 | 4 | 6 | 3 | 8 | 6 | 4 | 6 | 8 | 1 | 3 | 4 | 2 | 6 | 5 | 40 | 5.1 | 5 | 2.0 | 16 | 31.3% | |
| 5 | 6 | | 6 | 4 | 6 | 3 | | | | | | 1 | | 3 | 7 | 9 | 4 | 4 | 4 | 1 | 3 | 7 | 8 | 4 | 7 | 6 | 5 | 5 | 9 | 9 | 4 | 3 | 4 | 7 | 6 | 8 | 8 | 6 | 5 | 7 | 9 | 7 | 6 | 5 | 5 | 7 | 4 | 40 | 5.6 | 6 | 2.1 | 16 | 37.5% | |
| 6 | 0 | 0 | | 0 | 1 | 2 | | | | 3 | | 0 | | 0 | | | 0 | 0 | 0 | 0 | 1 | 1 | 0 | 0 | 0 | 0 | 0 | 0 | 0 | 1 | 0 | 0 | 0 | 1 | 0 | 0 | 1 | 0 | 1 | 0 | 0 | 0 | 0 | 0 | 0 | 1 | 0 | 39 | 0.3 | 0 | 0.7 | 11 | 0.0% | |
| 7 | 3 | 1 | | 2 | 1 | 1 | | | | 1 | | 1 | | 1 | | | 2 | 2 | 1 | 0 | 2 | 0 | 1 | 1 | 1 | 1 | 1 | 1 | 1 | 1 | 1 | 1 | 6 | 2 | 2 | 2 | 3 | 0 | 0 | 2 | 3 | 2 | 3 | 1 | 2 | 1 | 1 | 39 | 1.5 | 1 | 1.1 | 14 | 7.1% | |
| 8 | 4 | 4 | | 3 | 6 | 3 | | | | 4 | | 1 | | 6 | | | 2 | 4 | 3 | 3 | 7 | 4 | 2 | 2 | 4 | 3 | 2 | 4 | 4 | 2 | 2 | 5 | 3 | 4 | 4 | 2 | 4 | 3 | 4 | 5 | 5 | 1 | 1 | 3 | 5 | 5 | 5 | 39 | 3.5 | 4 | 1.4 | 12 | 33.3% | |
| 9 | 3 | 6 | | 3 | 7 | 6 | | | | 4 | | 5 | | 4 | | | 1 | 3 | 0 | 5 | 2 | 1 | 3 | 3 | 3 | 5 | 6 | 6 | 5 | 4 | 6 | 3 | 3 | 3 | 5 | 6 | 3 | 7 | 6 | 5 | 7 | 5 | 8 | 4 | 3 | 4 | 6 | 39 | 4.3 | 4 | 1.8 | 12 | 33.3% | |
| 10 | 1 | 1 | | 1 | 1 | 1 | | | | 2 | | 1 | | 0 | | | 1 | 2 | 1 | 0 | 0 | 1 | 2 | 2 | 3 | 3 | 3 | 2 | 3 | 1 | 0 | 2 | 2 | 2 | 1 | 2 | 0 | 2 | 3 | 2 | 2 | 3 | 1 | 1 | 2 | 0 | 2 | 39 | 1.5 | 2 | 0.9 | 10 | 20.0% | |
| 11 | 4 | 5 | | 3 | 4 | 3 | | | | 4 | | 7 | | 4 | | | 4 | 3 | 6 | 4 | 5 | 6 | 3 | 5 | 5 | 4 | 6 | 3 | 4 | 5 | 4 | 4 | 4 | 6 | 4 | 7 | 2 | 4 | 4 | 6 | 3 | 3 | 4 | 2 | 5 | 2 | 6 | 39 | 4.3 | 4 | 1.3 | 8 | 50.0% | |
| 12 | 4 | 3 | | 4 | 3 | 6 | 1 | | | 3 | | 2 | | 2 | | | 0 | 0 | 1 | 1 | 1 | 0 | 0 | 2 | 0 | 1 | 2 | 1 | 2 | 1 | 2 | 1 | 3 | 2 | 1 | 1 | 3 | 1 | 2 | 2 | 2 | 2 | 4 | 1 | 1 | 3 | 1 | 40 | 1.8 | 2 | 1.3 | 6 | 33.3% | ** |
| 13 | 0 | 2 | | 2 | 2 | 4 | 8 | | | 11 | | | 1 | 1 | | | 1 | 0 | 0 | 0 | 0 | 0 | 0 | 0 | 0 | 0 | 8 | 11 | 0 | 0 | 0 | 0 | 0 | 1 | 0 | 2 | 0 | 3 | 0 | 0 | 0 | 0 | 1 | 0 | 0 | 1 | 0 | 40 | 1.5 | 0 | 2.9 | 15 | 0.0% | |
| 14 | 0 | 0 | | 0 | | 1 | 0 | | | | | | | 0 | 1 | 0 | 0 | 0 | 1 | 3 | 0 | 0 | 2 | 0 | 2 | 0 | 8 | 1 | 0 | 0 | 0 | 0 | 0 | 1 | 0 | 1 | 2 | 0 | 1 | 2 | 0 | 1 | 0 | 1 | 0 | 1 | 2 | 39 | 0.8 | 0 | 1.4 | 9 | 0.0% | *** |
| 15 | 0 | 2 | | 0 | 1 | 4 | 4 | | | | 4 | | | 2 | 3 | 1 | 0 | 1 | 2 | 2 | 0 | 2 | 3 | 1 | 2 | 2 | 2 | 1 | 1 | 0 | 3 | 0 | 0 | 2 | 3 | 2 | 2 | 0 | 3 | 2 | 2 | 2 | 4 | 4 | 1 | 1 | 2 | 41 | 1.8 | 2 | 1.3 | 6 | 33.3% | *** |
| 16 | 9 | 9 | | 9 | 13 | 8 | 9 | | | | | | 9 | 10 | 9 | | 11 | 9 | 8 | 11 | 13 | 11 | 15 | 10 | 12 | 14 | 13 | 9 | 11 | 14 | 15 | 12 | 11 | 13 | 16 | 15 | 12 | 16 | 15 | 11 | 14 | 10 | 13 | 10 | 12 | 10 | 11 | 40 | 11.6 | 11 | 2.3 | 23 | 47.8% | **** |
| 17 | 0 | 4 | | | 8 | 6 | | 11 | | | | | 9 | 14 | 7 | | 14 | 9 | 9 | 11 | 7 | 11 | 2 | 10 | 12 | 5 | 6 | 0 | 2 | 7 | 12 | 12 | 12 | 12 | 9 | 10 | 1 | 15 | 11 | 12 | 4 | 15 | 21 | 6 | 14 | 9 | 13 | 39 | 9.0 | 9 | 4.6 | 21 | 42.9% | ***** |
| 18 | 1 | 1 | | | 0 | | | 1 | 0 | | | | 0 | 0 | 0 | | 3 | 4 | 1 | 3 | 3 | 4 | 1 | 0 | 2 | 3 | 5 | 2 | 4 | 3 | 3 | 5 | 4 | 3 | 4 | 5 | 2 | 2 | 1 | 2 | 7 | 3 | 3 | 1 | 2 | 4 | 3 | 39 | 2.4 | 3 | 1.7 | 11 | 27.3% | |
| 19 | 1 | 0 | | | 0 | | | | 0 | | | | 0 | 0 | 0 | | 1 | 1 | 1 | 1 | 1 | 1 | 2 | 1 | 1 | 3 | 2 | 2 | 2 | 2 | 0 | 0 | 1 | 0 | 0 | 0 | 2 | 0 | 0 | 0 | 1 | 1 | 2 | 3 | 0 | 2 | 0 | 38 | 0.9 | 1 | 0.9 | 3 | 33.3% | |
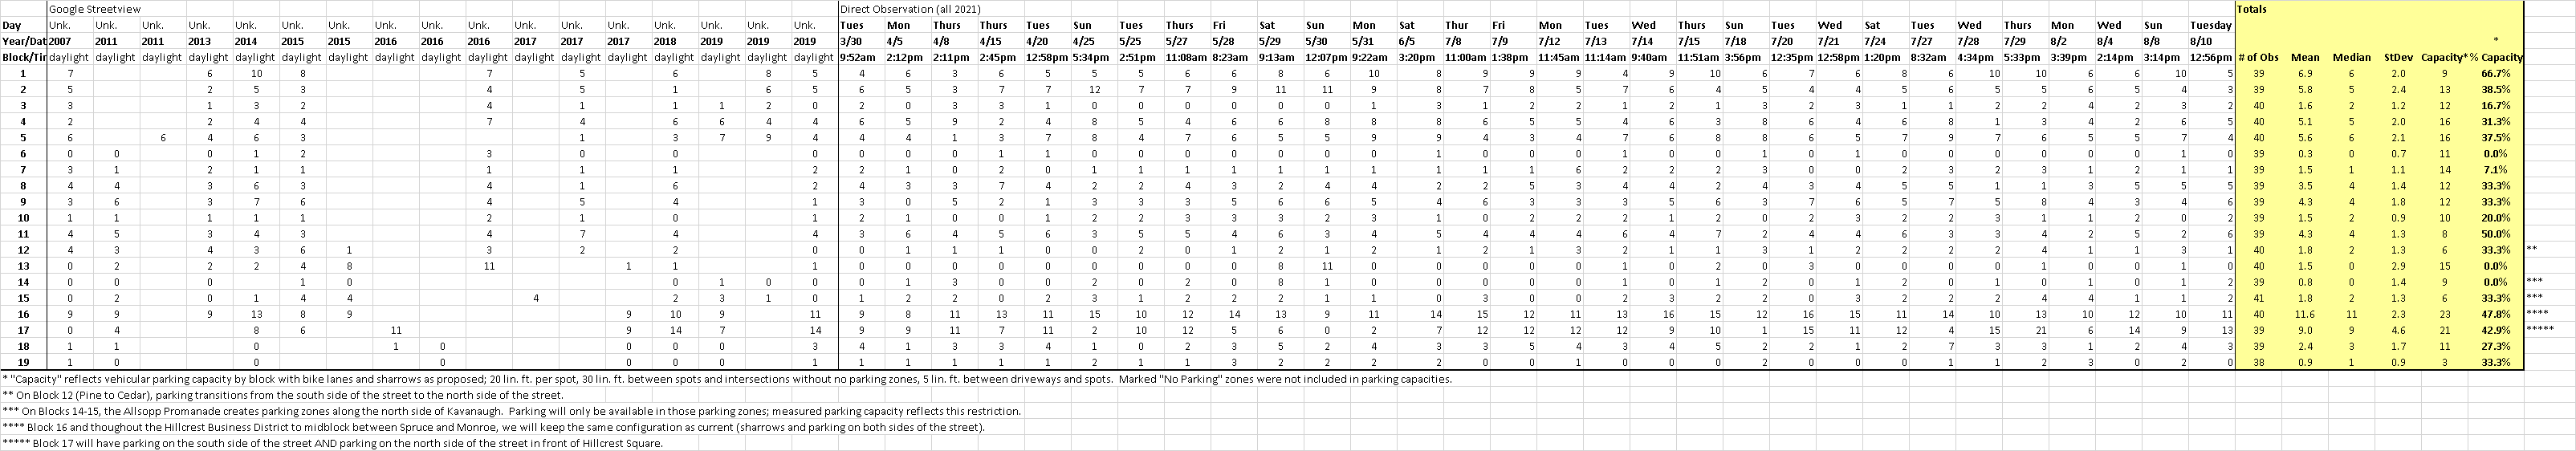
| * “Capacity” reflects vehicular parking capacity by block with bike lanes and sharrows as proposed; 20 lin. ft. per spot, 30 lin. ft. between spots and intersections without no parking zones, 5 lin. ft. between driveways and spots. Marked “No Parking” zones were not included in parking capacities. | | | | | | | | | | | | | | | | | | | | | | | |
| ** On Block 12 (Pine to Cedar), parking transitions from the south side of the street to the north side of the street. | | | | | | | | | | | | | | | | | | | | | | | | | | | | | | | | | | | | | | | | | | |
| *** On Blocks 14-15, the Allsopp Promanade creates parking zones along the north side of Kavanaugh. Parking will only be available in those parking zones; measured parking capacity reflects this restriction. | | | | | | | | | | | | | | | | | | | | | | | | | | | | | | | | | |
| **** Block 16 and thoughout the Hillcrest Business District to midblock between Spruce and Monroe, we will keep the same configuration as current (sharrows and parking on both sides of the street). | | | | | | | | | | | | | | | | | | | | | | | | | | | | | | | | | |
| ***** Block 17 will have parking on the south side of the street AND parking on the north side of the street in front of Hillcrest Square. |